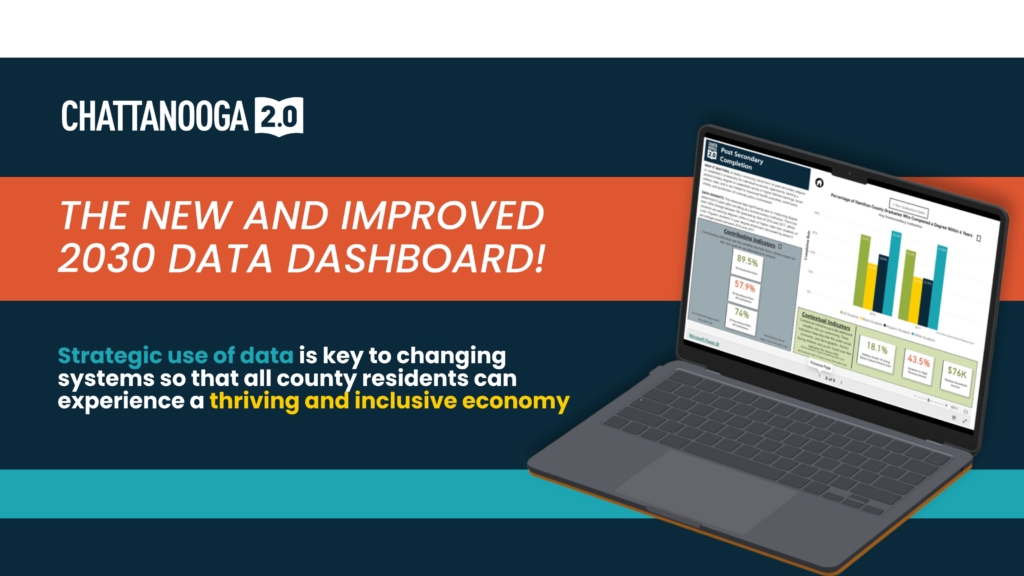
Chattanooga 2.0 holds data at the forefront of all cradle-to-career strategies and initiatives. We believe that strategic use of data is key to changing systems so that all county residents can experience a thriving and inclusive economy. In launching our 2030 goals dashboard, our aim is to foster collaboration across sectors by sharing data to show the interconnectedness of the work. This dashboard is designed to both hold Chattanooga 2.0 accountable to our goals and to help community organizations and local leaders inform and strengthen their work.
Our backbone organization’s five focus areas span from Kindergarten Readiness to Thriving Wage jobs and are reflected in our new dashboard. Hamilton County will only see real growth in these areas when stakeholders and organizations come together across sectors to target and implement data-informed initiatives. The dashboard dives into each focus area by exploring data disaggregated by economic status, race, and English learner status while providing contributing and contextual indicators. Contextual indicators give a picture of how the community is doing overall even if the indicators aren’t directly correlated with our specific focus area. Contributing indicators are variables that will have a direct impact on the core goal we are attempting to achieve. For example, chronic absenteeism rates among elementary school students are a contributing indicator to literacy rates. Reducing chronic absenteeism rates is associated with higher literacy rates. By connecting these data points, we’re inviting every sector to come together to support Hamilton County children and families.
Key Takeaways:
1. Literacy – 40.4% of 3rd-5th graders scored proficient on the ELA portion of the TCAP. Economically disadvantaged (ED) students score 35.1 percentage points behind their non-ED peers, indicating a stark achievement gap based on wealth. With 18.1% of children under 18 living below the federal poverty line and 43.5% of students in high poverty schools (those serving more than 40% ED students), research indicates that economic indicators are a key root cause. Check out our literacy work here.
2. Postsecondary Readiness – 43.8% of students are graduating with ReadyGraduate status meaning they are leaving high school prepared to attend a postsecondary institution, a training program or enter the workforce. The gap between non-ED and ED students is 29.5 percentage points, again highlighting the need for support to ensure all students can succeed after high school, regardless of their family income.
3. Economic Stability – Economic mobility is a significant challenge, with 24% of 25–34-year-olds in the county earning a Thriving Wage of $50,000 or more a year. Additionally, only 35% of jobs in the county require less than 5 years of experience and offer a thriving wage salary. This low percentage suggests an urgent need for pathways to higher-wage jobs and career advancement opportunities. Check out our pathways work here.
These insights point to the intersection between education, poverty, and economic mobility and the need for targeted interventions and community efforts to help close the gaps. We hope that this dashboard inspires the community to come together to support our children and youth. The data is meant to shine a light on opportunities for change, highlight where we are making strides, and where there is still work to be done.
Check out the 2030 Goals Dashboard here, dive into the data, and reach out with any questions. We are looking forward to the conversations this information sparks and the work ahead.


